
Share


If you’ve been following updates this week, you know that I’m in Sacramento for Wide Open Walls. The crew and I just completed my 15-story Johnny Cash at Folsom Prison mural, which is my largest in the state of California and my most technically ambitious mural ever. The art is based on a photo by Jim Marshall which I used originally as part of my American Civics series. I’m grateful to be able to create this image on such a large scale as a tribute for the 50th anniversary of Cash’s Live at Folsom Prison album, and I hope that this art will ignite a conversation around the need for incarceration reform. According to a recent in-depth study by the Prison Policy Initiative, America has the highest incarceration rate in the world with a shocking 2.3 million people currently imprisoned.
On top of that, our prisons are disproportionately filled with poor people of color, in fact, African Americans are 13% of the U.S. population, yet 40% of the prison population in this country. More African American men are under correctional control today than there were slaves in the 1850s according to a Huffington Post piece by writer and civil rights advocate Michelle Alexander.
A portion of proceeds from the Johnny Cash print I made, currently available through Toy Room Gallery, will benefit #Cut50. Thank you to Wide Open Walls, Branded Arts, and my crew of assistants, Dan Flores, Nic Bowers, Rob Zagula, and Luka Densmore for the 11-hour days we worked this week in the intense heat to get this mural finished! Thank you Jon Furlong for the photo!
Please take a moment to read this more in-depth piece highlighting the abhorrent prison statistics of our country. I hope that this information educates you to wake up and take action. Thanks for caring!

Can it really be true that most people in jail are being held before trial? And how much of mass incarceration is a result of the war on drugs? These questions are harder to answer than you might think, because our country’s systems of confinement are so fragmented. The various government agencies involved in the justice system collect a lot of critical data, but it is not designed to help policymakers or the public understand what’s going on. As public support for criminal justice reform continues to build, however, it’s more important than ever that we get the facts straight and understand the big picture.
This report offers some much needed clarity by piecing together this country’s disparate systems of confinement. The American criminal justice system holds almost 2.3 million people in 1,833 state prisons, 110 federal prisons, 1,772 juvenile correctional facilities, 3,134 local jails, 218 immigration detention facilities, and 80 Indian Country jails as well as in military prisons, civil commitment centers, state psychiatric hospitals, and prisons in the U.S. territories. This report provides a detailed look at where and why people are locked up in the U.S., and dispels some modern myths to focus attention on the real drivers of mass incarceration, including exceedingly punitive responses to even the most minor offenses.
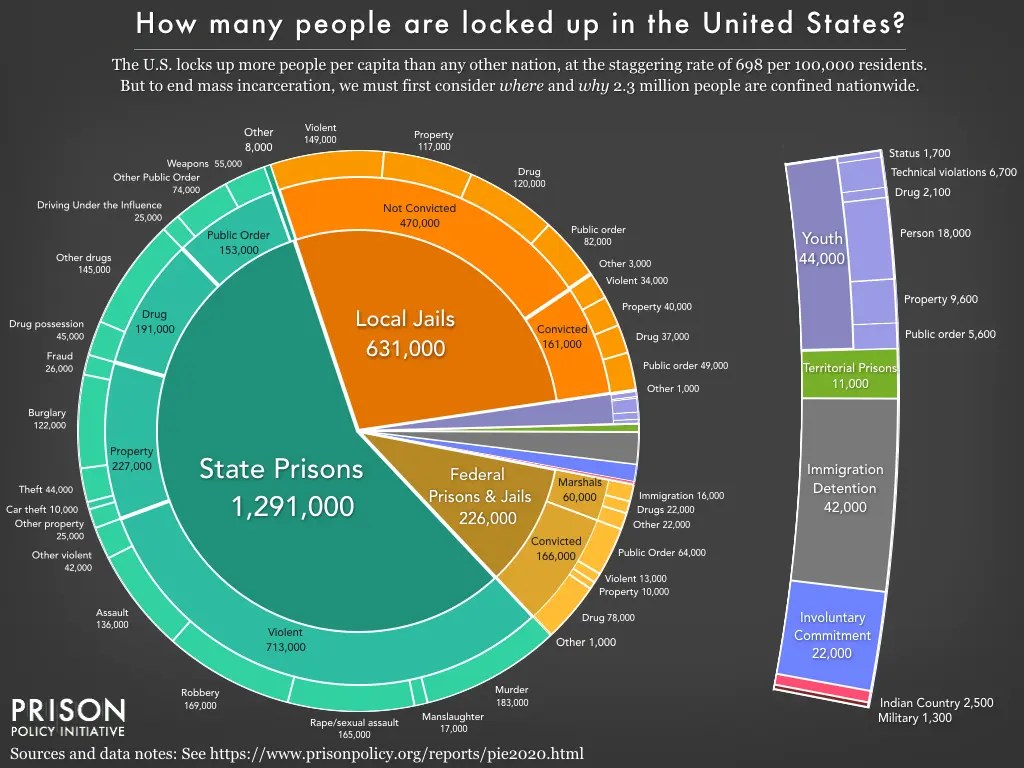


This big-picture view allows us to focus on the most important drivers of mass incarceration and identify important, but often ignored, systems of confinement. The detailed views bring these overlooked systems to light, from immigration detention to civil commitment and youth confinement. In particular, local jails often receive short shrift in larger discussions about criminal justice, but they play a critical role as “incarceration’s front door” and have a far greater impact than the daily population suggests.
While this pie chart provides a comprehensive snapshot of our correctional system, the graphic does not capture the enormous churn in and out of our correctional facilities, nor the far larger universe of people whose lives are affected by the criminal justice system. Every year, over 600,000 people enter prison gates, but people go to jail 10.6 million times each year. Jail churn is particularly high because most people in jails have not been convicted. Some have just been arrested and will make bail within hours or days, while many others are too poor to make bail and remain behind bars until their trial. Only a small number (about 160,000 on any given day) have been convicted, and are generally serving misdemeanors sentences under a year. At least 1 in 4 people who go to jail will be arrested again within the same year — often those dealing with poverty, mental illness, and substance use disorders, whose problems only worsen with incarceration.
More on Prisonpolicy.org.